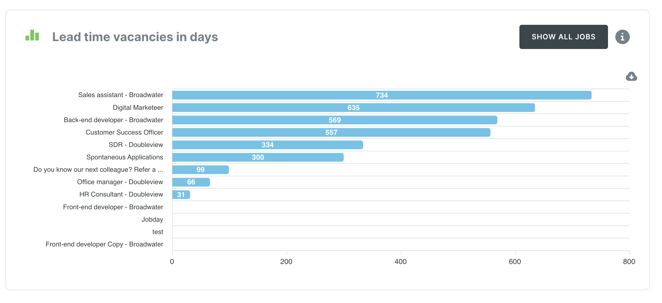
In the ‘Analytics’ module, go to the ‘Insights Vacancies’ tab to see the diagram for ‘Vacancy lead time in days’.
These graphs show the average lead time in days for your vacancies. See this article for a refresher of exactly how we calculate the lead time.
You can download the graph as an SVG, PNG or CSV file and paste it directly into your own reports. To do this, click on the grey cloud next to the graph.