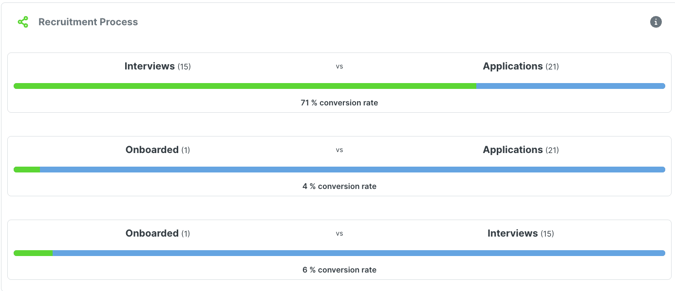
In the ‘Analytics’ module, go to the ‘Insights Hiring pipeline’ tab to see the ‘Hiring pipeline’ diagram. These images always show the conversion ratio between two pipeline phases.
You can see three ratios in total:
- Interviews vs Applications shows the number of interviewed candidates compared to all applications received. For example, you might see 3 interviews from 20 applications.
- Hired vs Applications shows the number of candidates hired compared to all applications received. For example, you might see 2 people hired from 20 applications.
- Hired vs Interviews shows the number of candidates hired compared to all candidates interviewed. For example, you might see 2 people hired from the 3 interviews.