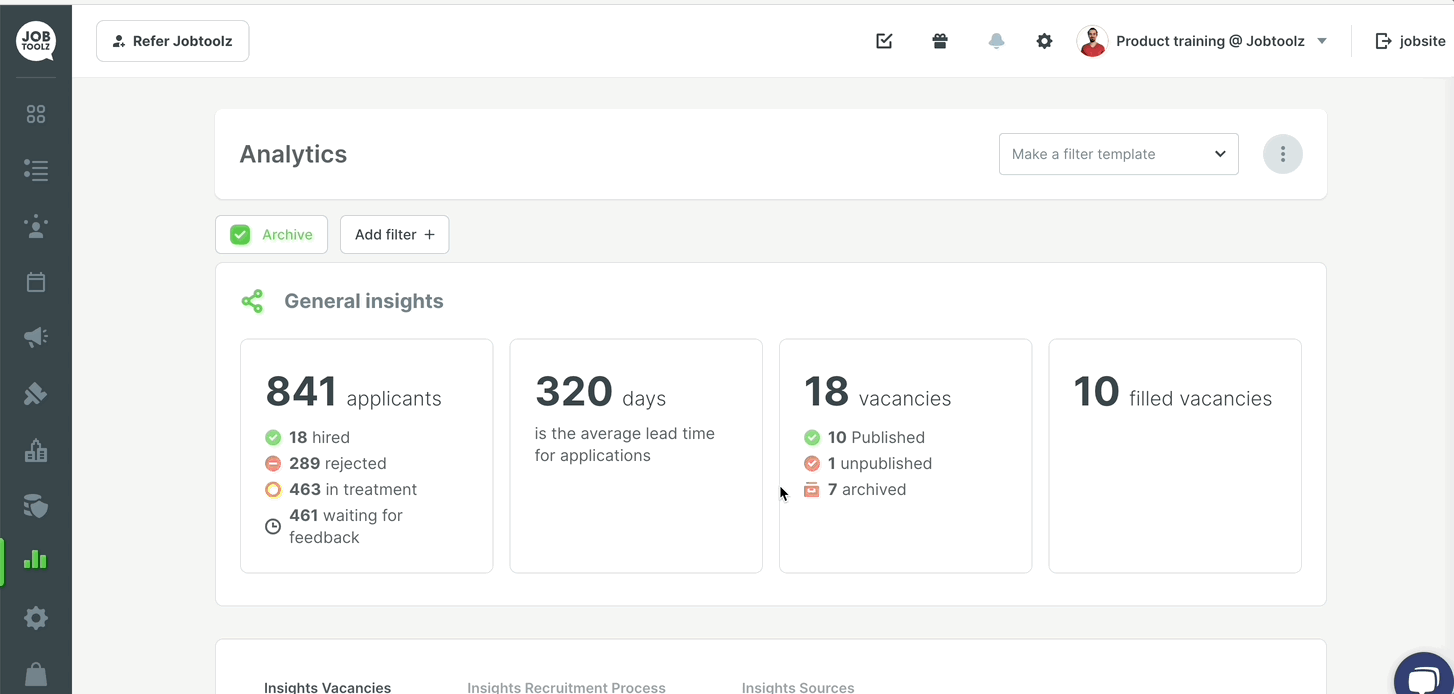
In the ‘Analytics’ module, go to the ‘Insights Vacancies’ tab to see the graphs for ‘Amount spent’.
These graphs show how much was spent via Jobtoolz on each vacancy. This can include spending on social media/video boosts and campaigns on job boards.
You can view graphs for the total amount for the vacancy, or view the amounts for social media and job boards separately. To change the graph, click on the key above the vacancies.
Above the graph, you also have an option for including vacancies in the results even if there is no spending associated with them.
You can download the graph as an SVG, PNG or CSV file and paste it directly into your own reports. To do this, click on the grey cloud next to the graph.