In the Statistics module, under the Job Insights tab, you’ll find the graph titled Average Time to Hire.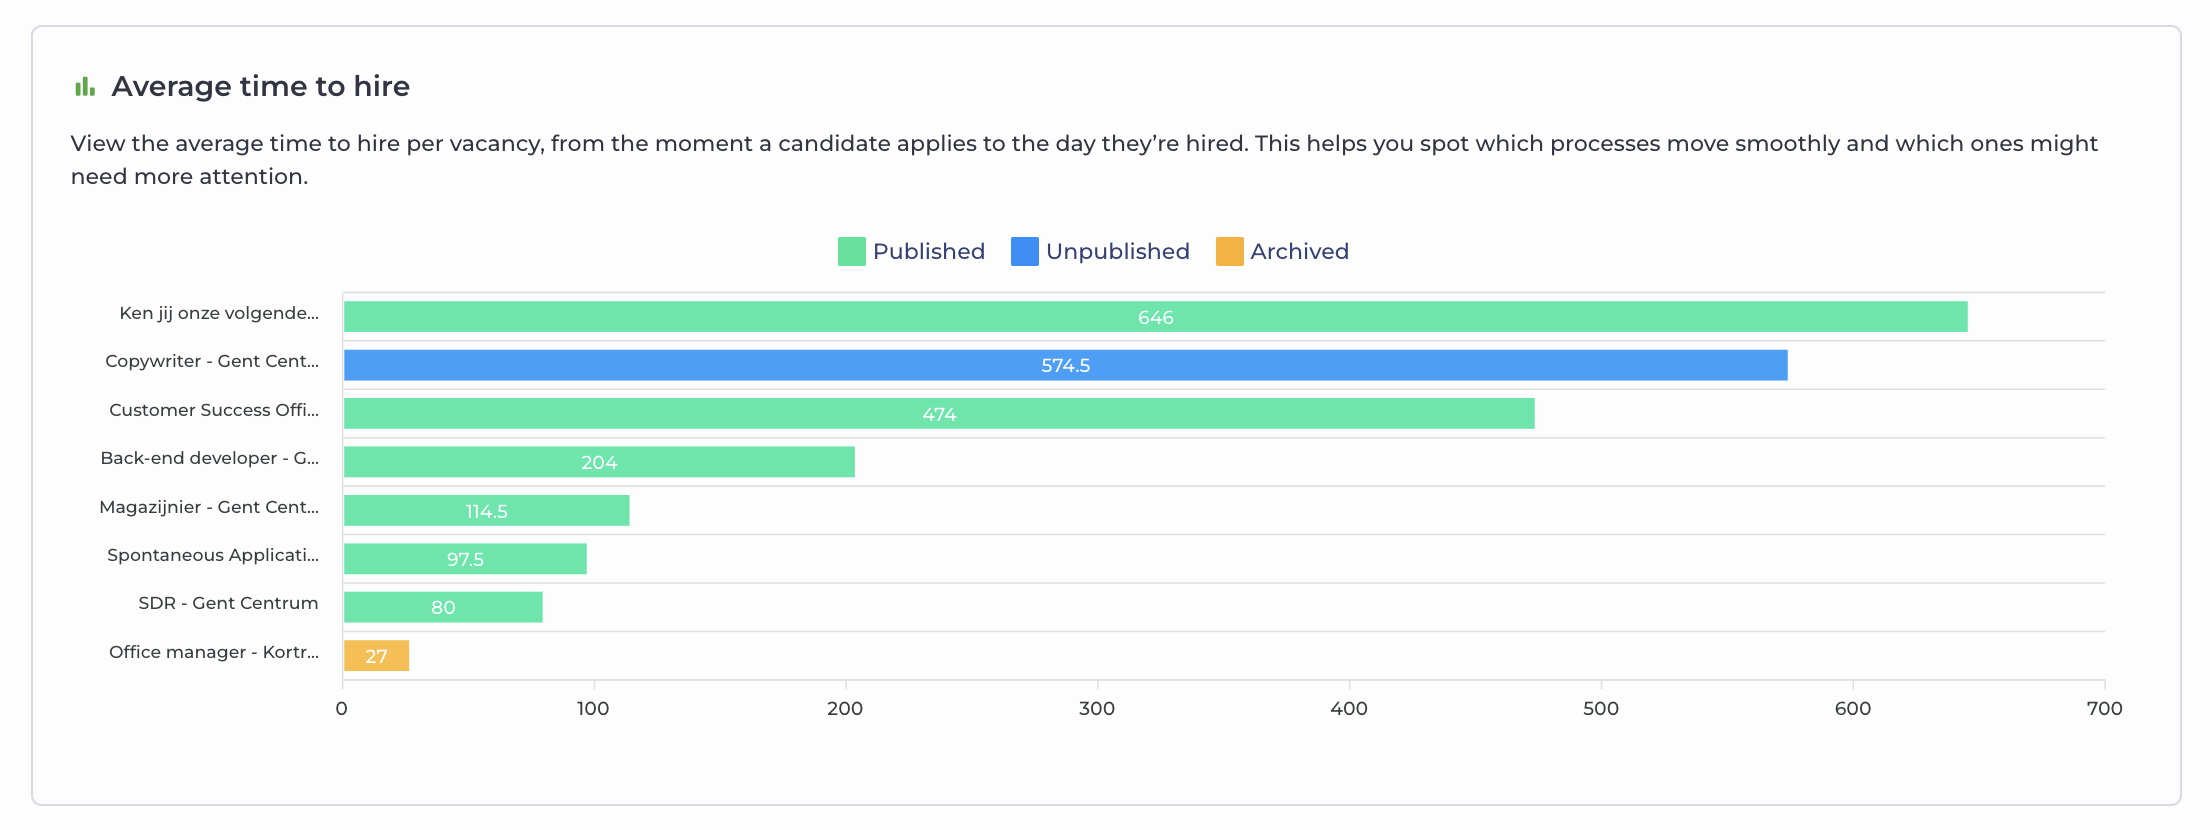
This graph shows the average number of days it takes to hire a candidate for a vacancy. It visualizes how long it typically takes to bring a candidate on board — from the moment they apply until they are officially hired.
Your time to hire is a valuable metric for assessing the speed and efficiency of your recruitment process.
You can also download this graph as an SVG, PNG, or CSV file, allowing you to easily include it in your own reports. To do this, simply click the grey cloud icon next to the graph.
In Jobtoolz, a candidate is considered “hired” once they are moved to a stage in your recruitment process where the “Activate onboarding” option is enabled. You can find more information about this setting here.